Plotly Dashboard for Rasdaman
Making a dashboard using python dash plotly pulling data from rasdaman database
Having heard of the performance of rasdaman in querying multidimensional arrays, we wanted to give it a try since our dataset is mostly spatial, and we want to benefit from fast processing of spatial time series data that rasdaman offers. We would like to explore the possibility of storing data from different kinds of measurements or maps (time series of meteorological data, results of soil sample analyses, different thematic maps, ...) in a rasdaman database. Ultimately, some of the functionalities we would like for the application are:
- Browse and download data of each meteorological station,
- Draw polygon and get average of different parameters for the whole area, and possibly as a time series where applicable
Data storage in rasdaman: "point data" are represented as a single pixel raster time series, where each pixel/image represents a rasterbrick (like a multispectral image where each band stores the value of a parameter e.g. temperature). Other raster data (soil maps, erosion maps...) could be stored in other coverages, and aggregation could be done later on through queries from python.
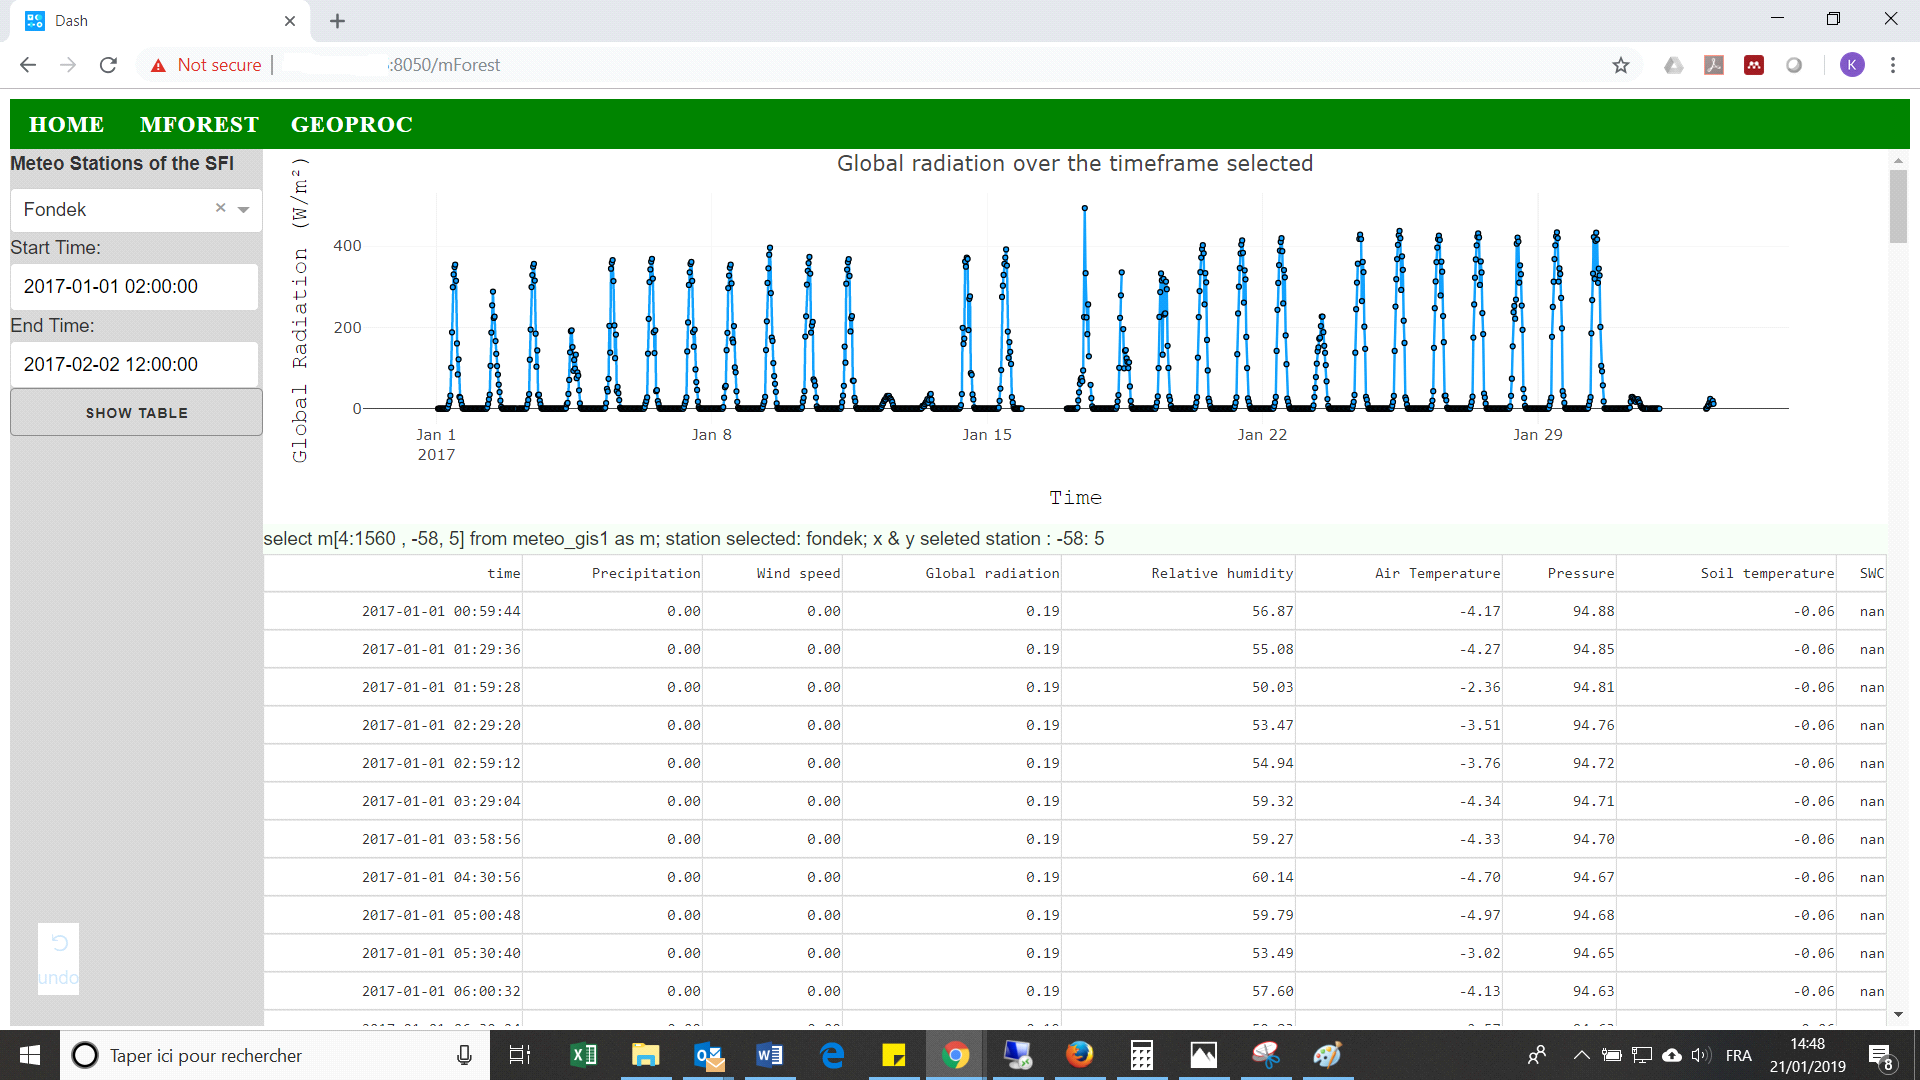
Selection of a meteo station to get parameters over time |
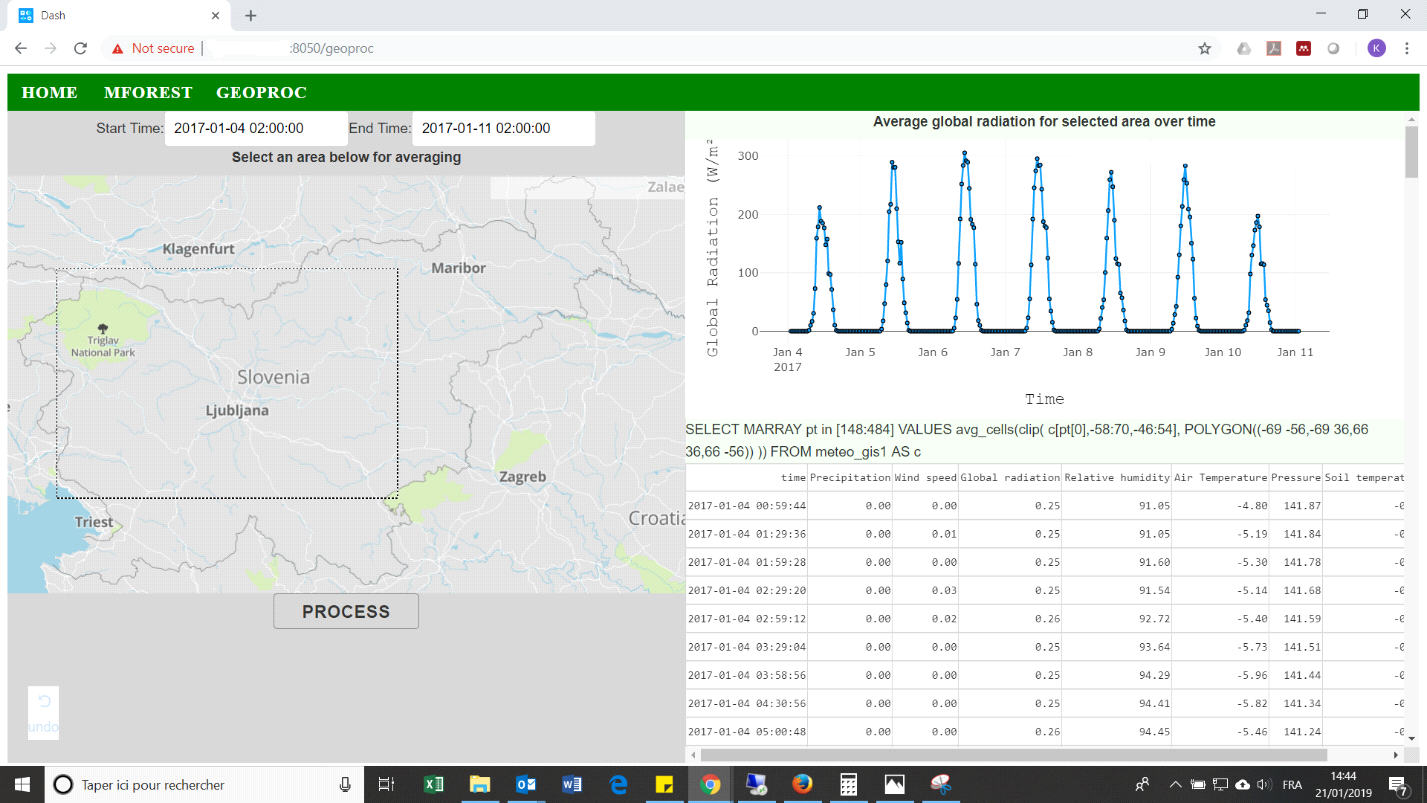
Selection of an area to get average of parameters over time |
Contact: