|
|
University of Alaska Fairbanks
Historical Sea Ice Atlas for the Arctic
This Atlas shows historical sea ice concentration in the Arctic, from 1850 to the present. You can view historical sea ice data from the seas around the circumpolar North and discover how ice concentrations have changed over time.
This Atlas shows snapshots in time, as well as long term patterns. It is not designed for forecasting or prediction, but can provide historical context for planning efforts.
Collecting and interpreting sea ice data has always been challenging. Charting conventions and interpretations of ice concentration have changed over time. Observing tools such as ships (1800s), airplanes (early 1900s), and satellites (1970s) have evolved as well. Atlas data begin with sea ice observations extrapolated from whaling ship log books in the Beaufort, Chukchi, and Bering seas starting in 1850. Estimates are used to fill gaps in log book data. Other data sources are incorporated as they were developed over time.
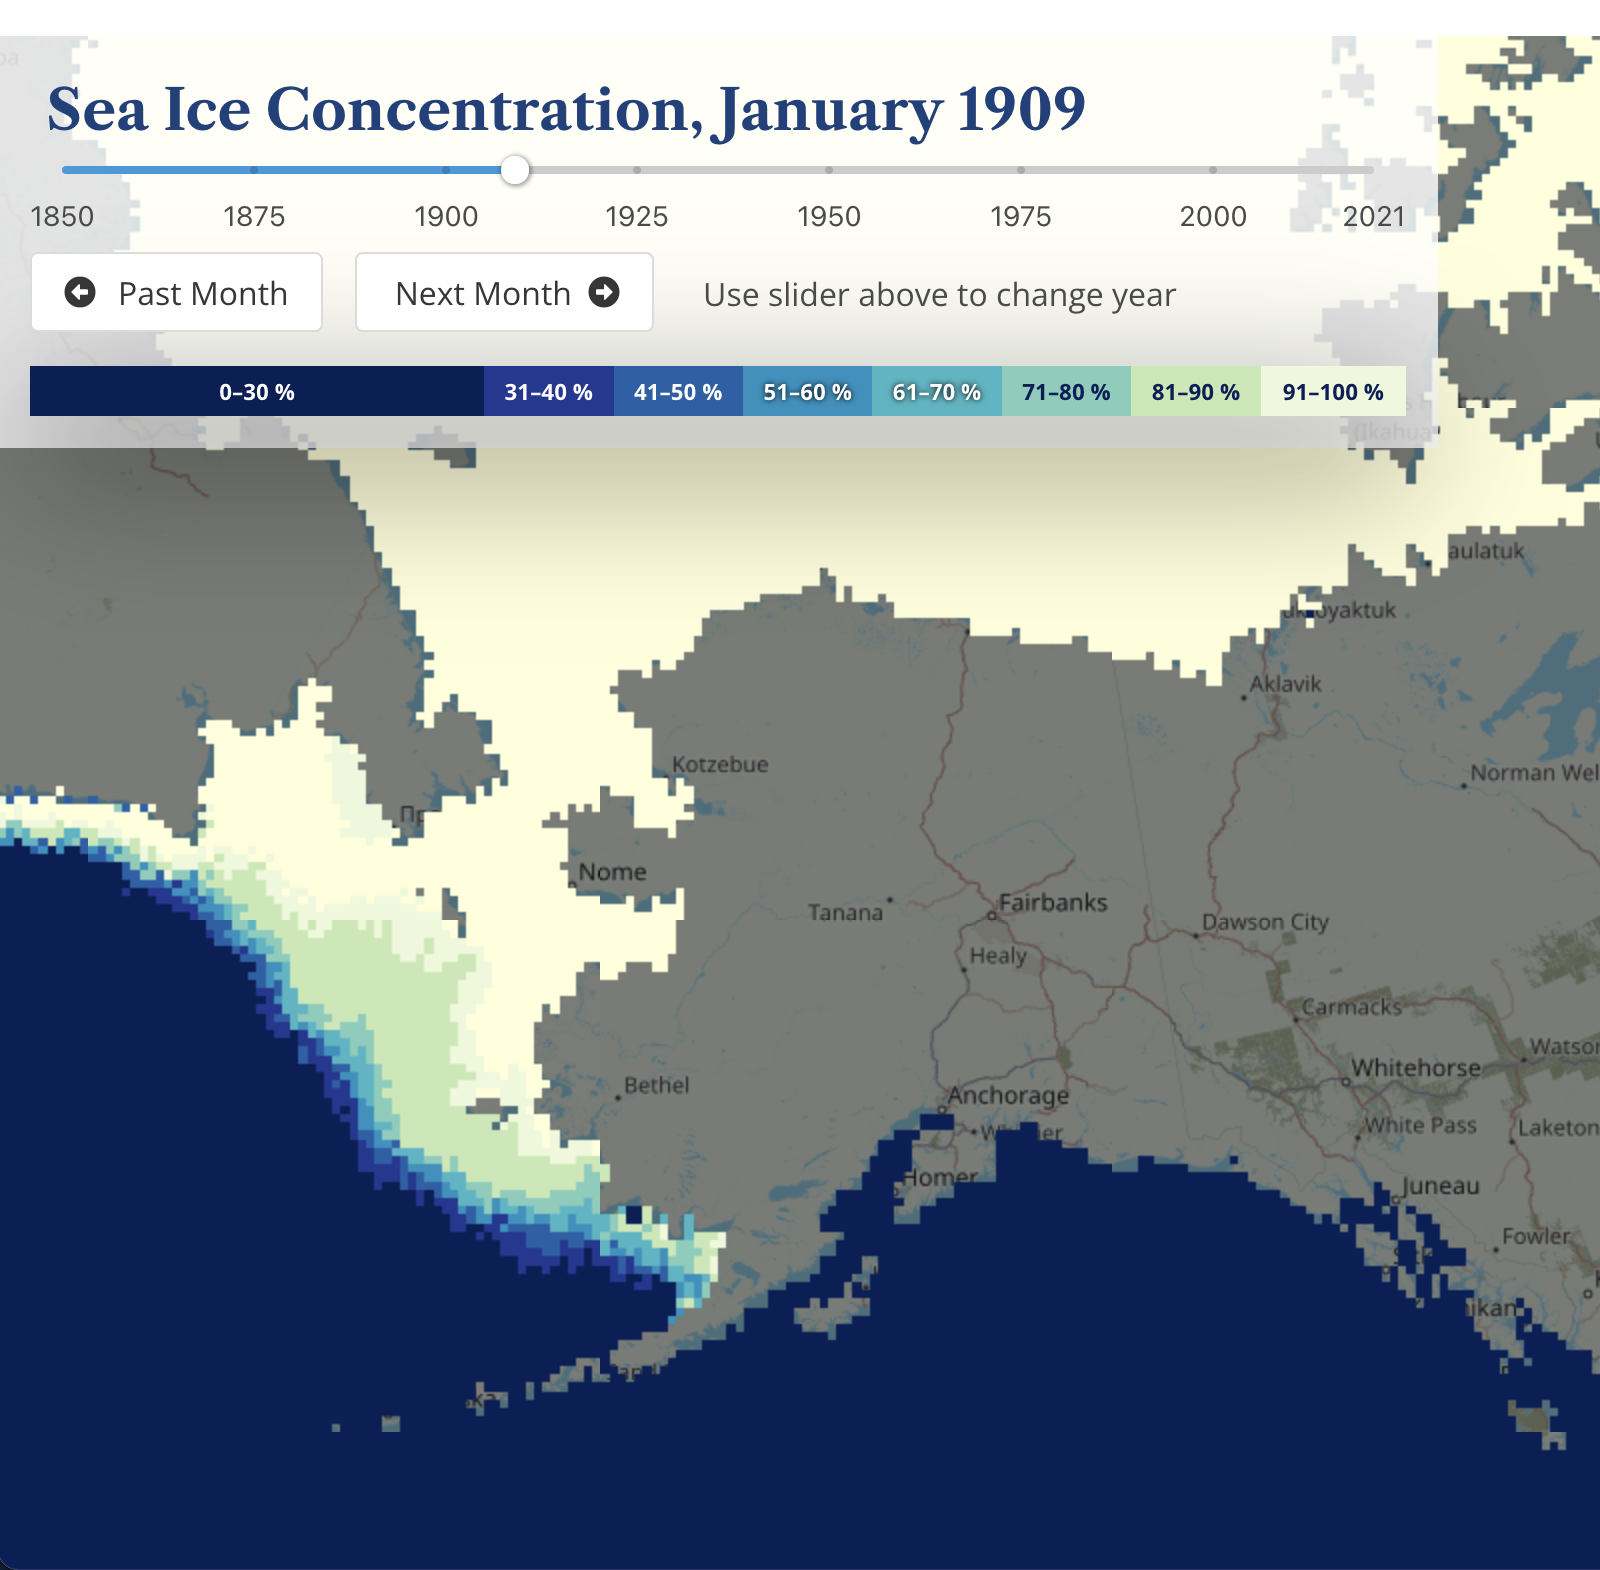
Figure 1: Screenshot of sea ice timeseries showing January 1909 |
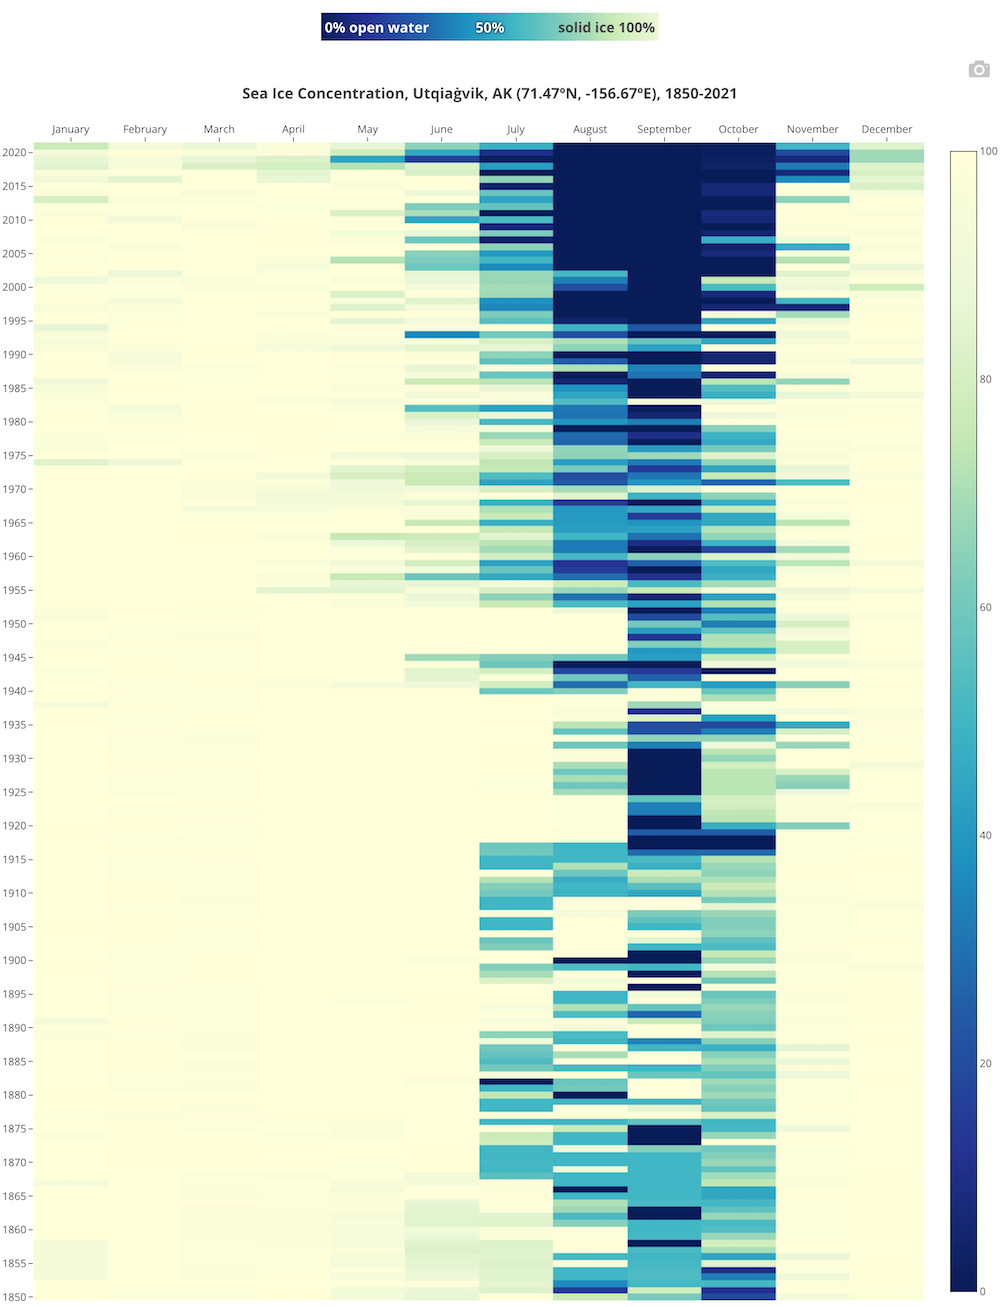
Figure 2: Sea ice concentration change over time |
Contact: , International Arctic Research Center, University of Alaska Fairbanks